While solving problem for day-06 of Advent of Code-2018, I happend to compute voronoi diagram.
Voronoi Diagram
voronoi diagram is an interesting partitioning scheme where we divide a plane into various
regions that is created by taking distance to fixed points lying in the same plane. Using the resulting regions, we can find to which
point (out of fixed points) an arbitarily chosen point is nearest to.
In terms of field, think of it as region where the fixed points have influence on to any other point on the plane.
Approach for Constructing Voronoi Diagram
plane generation
Say we have a n 2d points, named coords as:
[(x1, y1), (x2, y2), ... (xn, yn)]
Now, we construct a plane that consists of integer locations (where 2d points reside). We simulate this by actually creating
a list of points starting from (0, 0), (0, 1), …. (1, 0), (1, 1), (1, 2),.. to (a, b).
This is done by creating cross product between two lists of Xs and Ys.
Say, we have:
xx = [0, 1, 2, 3] and yy = [0, 1].
So, we generate every possible points on the plane using cross-product between xx and yy. The resulting matrix is:
[
0 0
0 1
1 0
1 1
2 0
2 1
3 0
3 1
]
So, we generate every possible points on the plane of size (width, height) which should generate width X height number of points on the plane.
Remember, this plane covers our initial n fixed points mentioned at the start.
Following code generates the points on the plane:
coord_matrix = np.array(coords)
X, Y = zip(*coords)
w, h = width, height
xx = list(range(w))
yy = list(range(h))
mat = np.array(list(itertools.product(xx, yy)))
Here, coord_matrix is a matrix of size nX2 and mat is the matrix of size (width X height, 2).
itertools module is used to find the cross product.
Distance Matrix
Now, we compute the distance of every point on the plane to the n fixed points on the plane.
That is: for every point in mat, we find distance to all the points in coord_matrix.
The distance can be any metric like:
For simplicity, here we use manhattan.
distances = manhattan_distances(mat, coord_matrix)
Here, distances matrix is of size ( widthXheight, n)
We make use of sklearn for computing the distances:
from sklearn.metrics.pairwise import manhattan_distances
computing nearest point
Using distances matrix, we just find the fixed point that is nearest. So, for each row in distances we use arg min to
find the index to the nearest fixed point.
dist_min_idx = np.argmin(distances, axis=1)
creating regions
This is the main part where we create regions in the plane by making use of dist_min_idx.
So, we create a 2d array that represent the whole plane and consists of all the points in mat.
arr = np.zeros((w, h))
Then, we loop through each row in mat. This is basically iterating over every point in the plane.
for i, p in enumerate(mat):
    r, c = p
    idx = dist_min_idx[i]
    dist = distances[i]
    mn = np.min(dist)
    arr[r, c] = dist_min_idx[i]
Here, we are accessing every location in the plane and then for each location we are simply assigning the index of nearest fixed point.
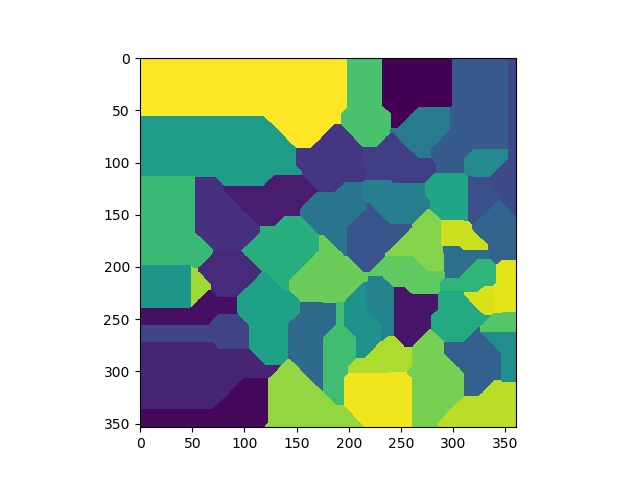
Finally, we plot the 2d array using matplotlib:
plt.imshow(arr)
plt.show()
This gives us voronoi diagram like this:
Note
The list of 2d points used for generating this voronoi diagram can be found here